Choose the visual workflow when the schema is still a design
DB Diagram is a visual relational database design tool. You create tables, edit columns, and connect foreign keys directly. The editable diagram is the source; SQL is generated from it when you want to review or export a script. You do not need existing CREATE TABLE statements to begin.
Use SQL to ERD when you already have SQL that you want to visualize and maintain. Use ERD Builder for conceptual Chen or EER modeling. These tools have separate documents: opening generated SQL from DB Diagram creates a new SQL workspace rather than turning the visual file into a SQL file.
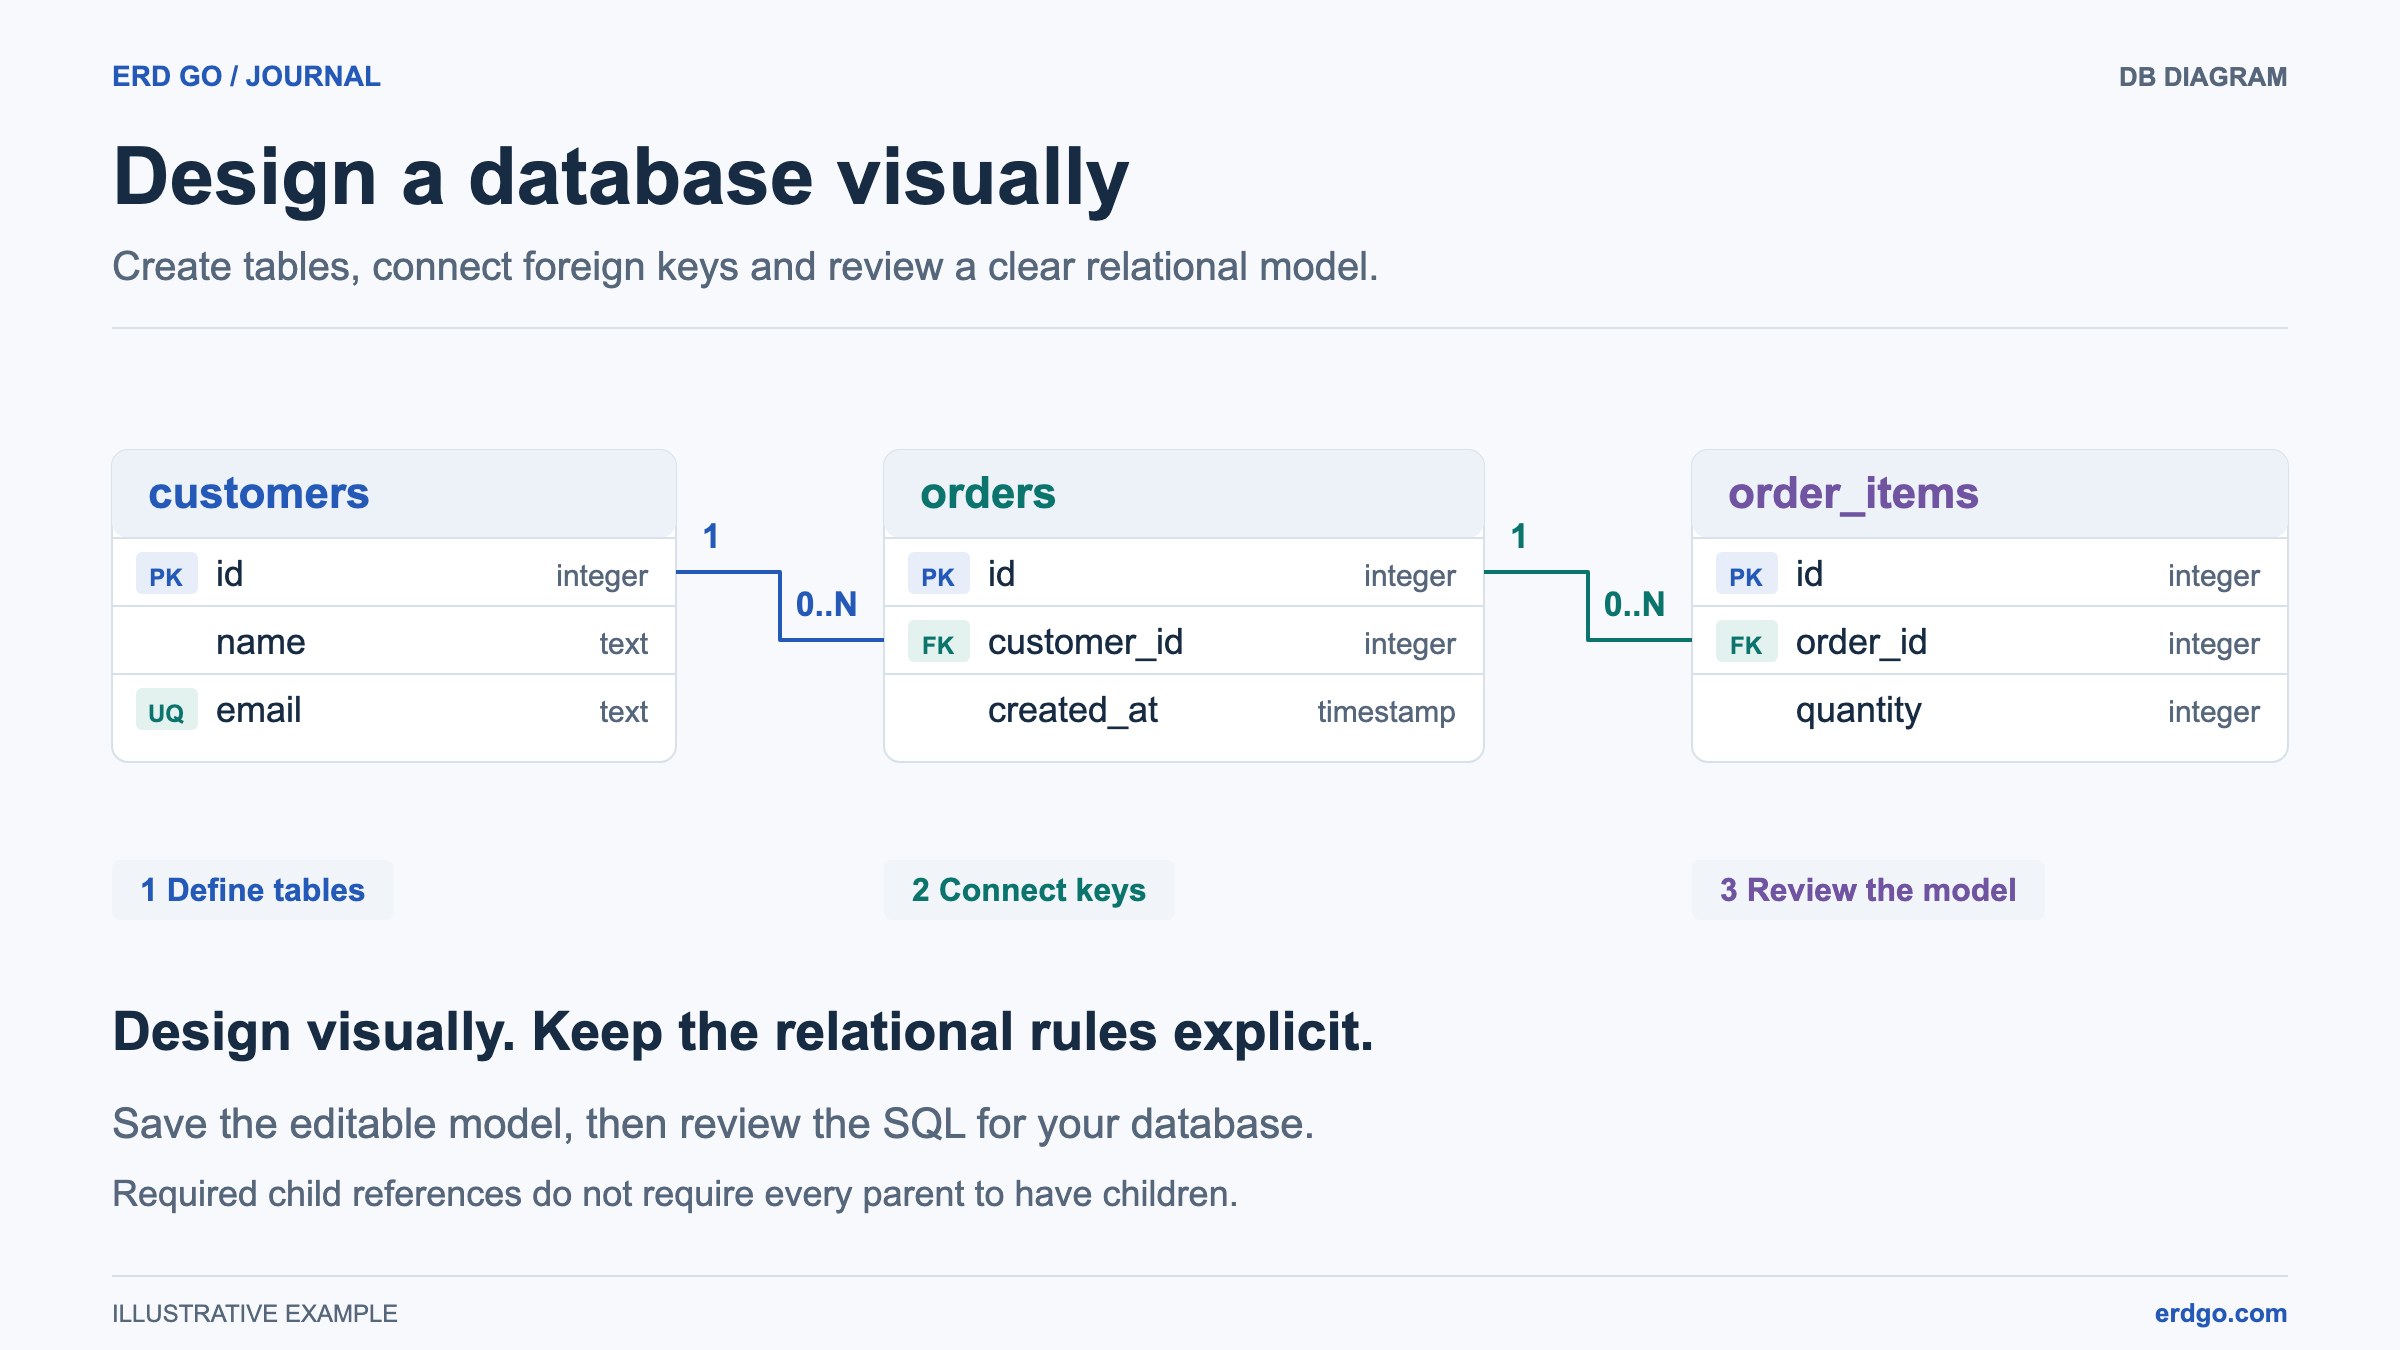
This tutorial designs a small order system. The rule is simple: each order belongs to one customer, and each order item belongs to one order. A customer may exist before placing an order. We will leave payments, stock, and shipping for another design review.
Start with tables and explicit column choices
Open DB Diagram and choose Blank database, or explore the order-system example first. Select PostgreSQL as the target dialect for this walkthrough. Choose the dialect before filling in types so the design uses the database vocabulary you intend to export.
Add customers, orders, and order_items. Open a table with its sidebar chevron or canvas pencil. Edit column names and types in the expanded table card. The N control under NULL allows or requires a value, and the Key control toggles primary-key membership. Open Column options for Unique, Auto increment, and a SQL default expression. Selecting a table on the canvas highlights it without moving your camera or opening another table editor.
Use the definitions below as the first pass. INT is deliberate on both ends of each relationship. Choose whether identifiers should be generated automatically rather than assuming that marking a primary key also configures an identity generator.
| Table | Columns | Key decisions |
|---|---|---|
| customers | id INT; name VARCHAR(120) | id is the primary key; name is not nullable. |
| orders | id INT; customer_id INT | id is the primary key; customer_id is not nullable. |
| order_items | id INT; order_id INT; quantity INT | id is the primary key; order_id and quantity are not nullable. |
Connect the referencing column to the referenced key
Create a relationship from orders.customer_id to customers.id. Then connect order_items.order_id to orders.id. The column holding the reference is in the child table; the referenced key belongs to the parent. In the relationship controls, review the actual endpoint names before adding the link.
DB Diagram supports single-column and composite foreign keys. For a composite key, choose the complete primary or unique key and review all column pairs. They are saved, edited and exported as one relationship.
Read the order rule in both directions. Requiring orders.customer_id means every order needs a customer reference. It does not require every customer to have an order. Keep customer_id non-unique when several orders may belong to the same customer.
If you rename customers or its id column later, the connection follows the same model identities. Deleting a referenced table or column removes the relationships attached to it after confirmation. Use Undo if that was not the intended change.
Add context, then review the schema decisions
Add a table comment explaining what counts as an order in this application. If draft orders may have no items, record that decision for the team. A diagram is easier to maintain when a reviewer can understand why a constraint exists, rather than seeing only its name.
For the PostgreSQL example, consider a named index on orders.customer_id and another on order_items.order_id when reviewing reference lookups. Add indexes through the expanded table editor; an index name in a comment does not create an index definition. The right indexes depend on the queries and write costs you expect.
Open Review above the table list for advisory findings about empty tables, missing primary keys, foreign-key index coverage, and duplicate index definitions. Click a finding to reveal its exact table, column, or index. Review suggests questions; it does not change your design or prove that a query plan will be fast.
Use a foreign-key badge in the table editor to follow a reference to its destination. This reveals the destination row without changing zoom or pan. Use Locate only when you deliberately want to center a table on the canvas.
Arrange the canvas without changing the data rules
Place customers next to orders, with order_items beside its parent. Drag table headers to move cards. Use Fit to Screen to see the whole model, then check that names and connections remain readable at the size you will share.
Create a named table group when several tables belong to one part of the system. A group lets you move its members together by dragging its frame header. Ungrouping keeps the tables and connections. Group membership, color, and position are presentation choices; they do not add a database namespace or change generated SQL.
On desktop, drag the divider between the tables panel and canvas to make room for long column names. On a phone, switch between Diagram and Tables & details. Keep color purposeful: a shared color can make a group easy to scan, while a comment should explain its actual responsibility.
Save the editable model and review generated SQL
A new design stays in memory until you save or download it. Sign in and choose Save to keep a DB Diagram cloud file, then save your latest changes before sharing its public read-only link. Download JSON gives you an editable portable copy that this tool can import later.
Export SQL to inspect, copy, or download the generated script for your selected dialect. Open it in the SQL workspace if you want to inspect its ERD, Data, or Query views. Changes made in that new SQL document do not synchronize back into the visual design.
Export PNG, SVG, or PDF when the audience needs an image. Keep JSON or the saved DB Diagram file as the editable source. Images and generated SQL are useful deliverables, but they do not preserve every canvas and editing detail in the visual document.
DB Diagram does not connect to a live database or apply migrations. It does not import arbitrary SQL. Before running exported SQL elsewhere, review the target database version, defaults, constraints, and deployment procedure with the people responsible for that database.
References and further reading
Build and review your own database diagram
Start with a blank design or explore the order-system example, then keep an editable copy of your work.